有时候我们想知道一个函数的图像是什么样子的,用R语言很好实现,这里分别用两种方法来实现一种方法是通过 graphics包中的
curve()函数来实现,一种方法是用ggplot2来实现。
# 分别画sigmoid公式和sin公式
- sigmoid公式:
- sin公式:
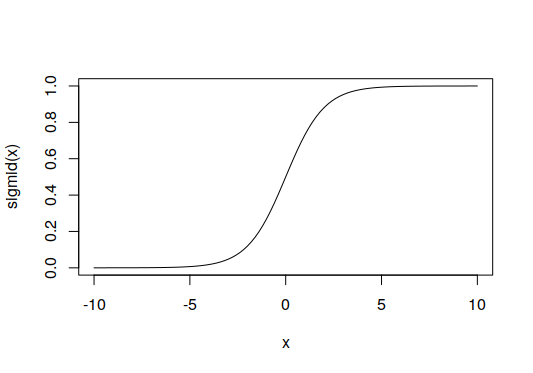
用curve()画函数图像
#定义公式
sigmoid <- function(x) 1/(1+exp(-x))
#画sigmid图像
curve(sigmoid,-10,10)
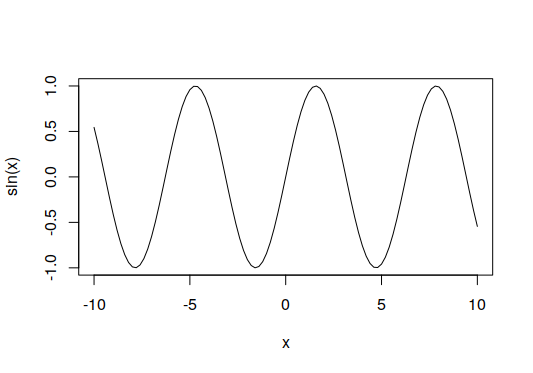
#画sin(x)数图像
curve(sin,-10,10)
sigmoid图像
sin图像
用ggplot2绘制函数图像
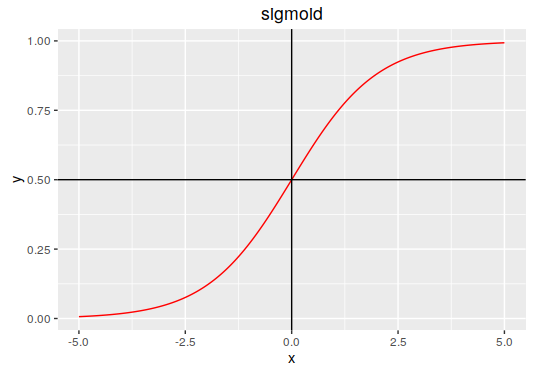
绘制sigmoid函数
library(ggplot2)

# 定义函数
sigmoid <- function(x) 1/(1+exp(-x))

# 创建数据点
x<-seq(-5, 5, by=0.01)
y<-sigmoid(x)
df<-data.frame(x, y)

# 用ggplot2来画图
g <- ggplot(df, aes(x,y))
g <- g + geom_line(col='red')
g <- g + geom_hline(yintercept = 0.5) + geom_vline(xintercept = 0) #坐标轴
g <- g + ggtitle("sigmoid")
g
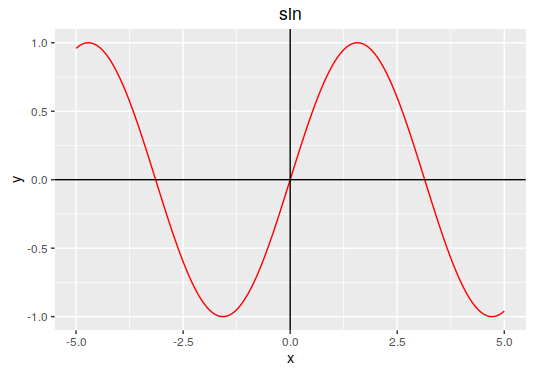
绘制sin函数
library(ggplot2)

# 创建数据点
x <- seq(-5, 5, by=0.01)
y <- sin(x)
df <- data.frame(x, y)

# 用ggplot2来画图
g <- ggplot(df, aes(x,y))
g <- g + geom_line(col='red')
g <- g + geom_hline(yintercept = 0)+geom_vline(xintercept = 0) #坐标轴
g <- g + ggtitle("sin")
g