记录下使用 DESeq2 package 的使用方法。 DESeq2 也是基于分析 RNA-seq counts 数据来进行差异表达基因的分析包。
DESeq2 包的安装
- 安装:
## try http:// if https:// URLs are not supported
>source("https://bioconductor.org/biocLite.R")
>biocLite("DESeq2")
数据导入
- 导入 count 矩阵,导入数据的方式很多这里直接导入 count 矩阵,关于原始的 count 数据是什么样子可以在我另一篇博客使用 R 语言 edgeR 包对RNA-seq测序结果下游分析中查看。
- count 结果如下:
library(DESeq2)
sampleNames <- c("CA_1","CA_2","CA_3","CC_1","CC_2","CC_3")
mydata <- read.table("counts.txt", header = TRUE, quote = '\t',skip =1)
names(mydata)[7:12] <- sampleNames
countMatrix <- as.matrix(mydata[7:12])
rownames(countMatrix) <-mydata$Geneid
table2 <- data.frame(name = c("CA_1","CA_2","CA_3","CC_1","CC_2","CC_3"),condition = c("CA","CA","CA","CC","CC","CC"))
rownames(table2) <- sampleNames
head(countMatrix)

         CA_1 CA_2 CA_3 CC_1 CC_2 CC_3
gene1314    0    0    0    0    0    0
gene1315    0    0    0    0    0    0
gene1316    0    0    0    0    0    0
gene1317    0    0    0    0    0    0
gene1318    0    0    0    0    0    0
gene1319    0    0    0    0    0    0
- 把 count 矩阵转化为 DESeq2 的数据格式
>dds <- DESeqDataSetFromMatrix(countMatrix, colData=table2, design= ~ condition)

> dds
class: DESeqDataSet
dim: 14217 6
metadata(0):
assays(1): counts
rownames(14217): gene1314 gene1315 ... gene6710 gene6709
rowRanges metadata column names(0):
colnames(6): CA_1 CA_2 ... CC_2 CC_3
colData names(2): name condition
过滤
- 过滤掉那些 count 结果都为 0 的数据,这些没有表达的基因对结果的分析没有用
dds <- dds[ rowSums(counts(dds)) > 1, ]
dds
class: DESeqDataSet
dim: 4190 6
metadata(0):
assays(1): counts
rownames(4190): gene1321 gene1322 ... gene6712 gene6710
rowRanges metadata column names(0):
colnames(6): CA_1 CA_2 ... CC_2 CC_3
colData names(2): name condition
PCA分析
rld <- rlog(dds)
plotPCA(rld, intgroup=c("name","condition"))
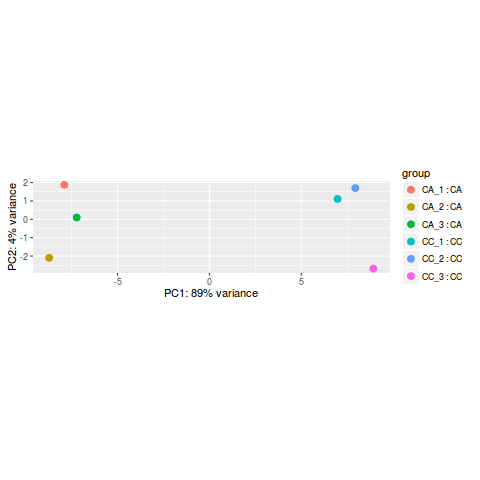
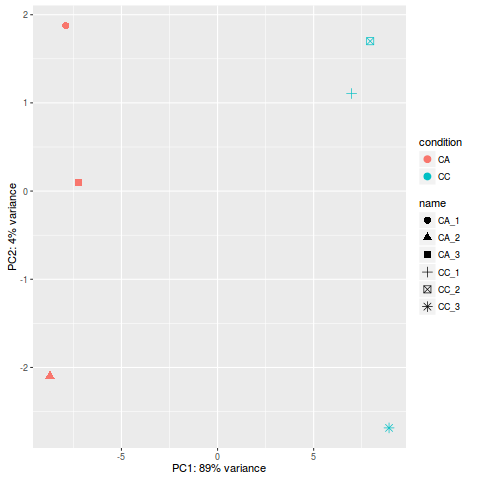
- 当然也可以使用 ggplot2 来画 PCA 图
library(ggplot2)
rld <- rlog(dds)
data <- plotPCA(rld, intgroup=c("condition", "name"), returnData=TRUE)
percentVar <- round(100 * attr(data, "percentVar"))
p<- ggplot(data, aes(PC1, PC2, color=condition, shape=name)) +
geom_point(size=3) +
xlab(paste0("PC1: ",percentVar[1],"% variance")) +
ylab(paste0("PC2: ",percentVar[2],"% variance"))
p
注意在进行 PCA 分析前不要
library(DESeq)否则无法进行 PCA 分析
差异表达基因分析
分析结果输出
library(DESeq)
dds <- DESeq(dds)
res <- results(dds)
write.table(res,"result.csv", sep = ",", row.names = TRUE)
head(res)

log2 fold change (MAP): condition CC vs CA
Wald test p-value: condition CC vs CA
DataFrame with 6 rows and 6 columns
           baseMean log2FoldChange     lfcSE       stat       pvalue
          <numeric>      <numeric> <numeric>  <numeric>    <numeric>
gene1321 173.288681     0.26267959 0.2049983  1.2813742 2.000623e-01
gene1322   2.118367    -0.05237952 0.4989589 -0.1049776 9.163936e-01
gene1323  35.973701     0.50054580 0.3038096  1.6475641 9.944215e-02
gene1324  88.421661     0.17677605 0.2402727  0.7357309 4.618945e-01
gene1325  43.001828     0.81143104 0.2919396  2.7794486 5.445127e-03
gene1326 662.136259    -1.05356105 0.1752230 -6.0126880 1.824720e-09
                 padj
            <numeric>
gene1321 3.790396e-01
gene1322 9.559679e-01
gene1323 2.337858e-01
gene1324 6.565731e-01
gene1325 2.447141e-02
gene1326 4.520861e-08
注: (1)rownames: 基因 ID (2)baseMean:所有样本矫正后的平均 reads 数 (3)log2FoldChange:取 log2 后的表达量差异 (4)pvalue:统计学差异显著性检验指标 (5)padj:校正后的 pvalue, padj 越小,表示基因表达差异越显著
summary查看整体分析结果
summary(res)

out of 4190 with nonzero total read count
adjusted p-value < 0.1
LFC > 0 (up)     : 595, 14%
LFC < 0 (down)   : 644, 15%
outliers [1]     : 0, 0%
low counts [2]   : 325, 7.8%
(mean count < 1)
[1] see 'cooksCutoff' argument of ?results
[2] see 'independentFiltering' argument of ?results
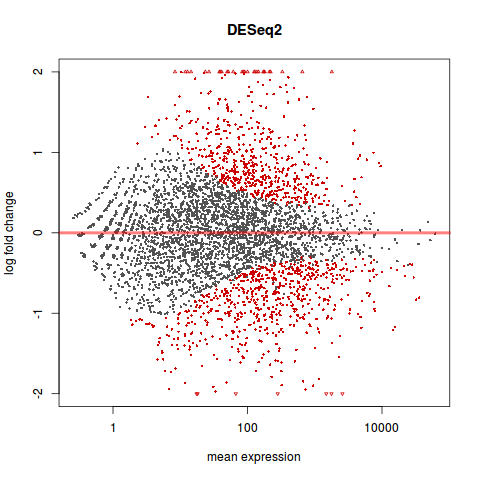
MA 图
library(geneplotter)

plotMA(res, main="DESeq2", ylim=c(-2,2))
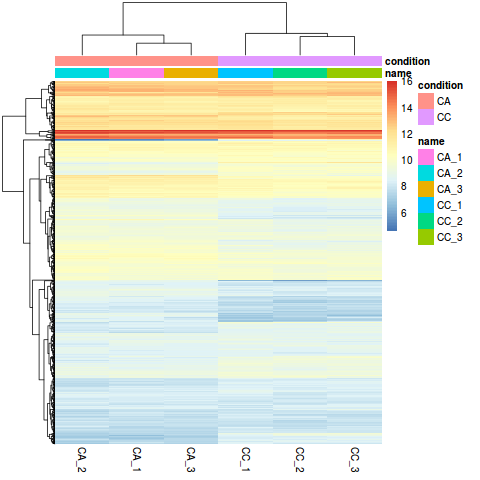
Heatmap 图
sum(res$padj < 0.1, na.rm=TRUE)

library("pheatmap")
select <- order(rowMeans(counts(dds,normalized=TRUE)),decreasing=TRUE)[1:1000]
nt <- normTransform(dds) # defaults to log2(x+1)
log2.norm.counts <- assay(nt)[select,]
df <- as.data.frame(colData(dds)[,c("name","condition")])
pdf('heatmap1000.pdf',width = 6, height = 7)
pheatmap(log2.norm.counts, cluster_rows=TRUE, show_rownames=FALSE,
cluster_cols=TRUE, annotation_col=df)
dev.off()